Malawi’s rainfall during El Niño – what can we learn from the past?
The upcoming “Super El Niño” has become one of the most talked-about climate terms for 2026. This is important due to its large impacts on rainfall in the Tropics. In some areas, like Brazil and Australia, these impacts are almost similar each time, but in other areas, like Malawi, they are less predictable. Here we, a team from the ARCS project, attempt to unpack the complex relationship between El Niño and rainfall over Malawi.
El Niño events are triggered when the ocean surface in the tropical part of the East Pacific Ocean becomes much warmer than normal. Over the coming months, the deviation from the normal state is forecast to exceed 2 degrees Celsius. The World Meteorological Organization has recently announced a 90% probability that these warm anomalies remain until at least the end of November.
El Niño’s strong influence on regional rainfall and temperature varies depending on the season and geographical location. For instance, it generally leads to wetter-than-normal conditions during the October–December rainy season in Eastern Africa, while Southern Africa usually experiences a drier-than-normal October–April period.
In areas located between Eastern and Southern Africa, such as Malawi, northern Zambia and northern Mozambique, the effects of El Niño on rainfall are somehow fuzzy and can vary significantly from one El Niño event to another. This is due to several factors, including the intensity of the El Niño itself (how warm the ocean gets), or its interaction with other large weather and climate patterns. A forecaster at Malawi's national weather service once said that “Malawi sometimes cannot fully decide whether it’s part of Southern or Eastern Africa during an El Niño year”.
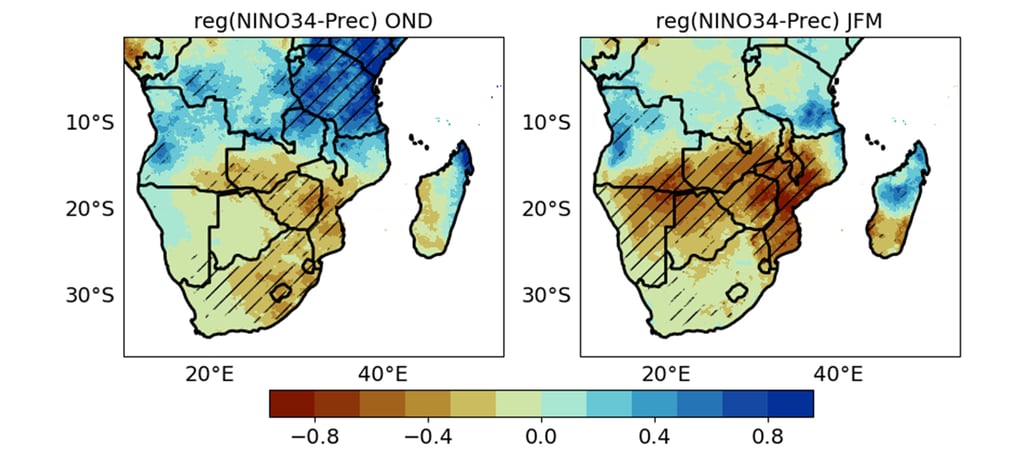
Malawi’s rainy season usually starts in November/December and ends around April. During an El Niño event, the rainfall patterns shift: in central and northern Malawi, the November-December rain tends to increase. In the south, the early season rain weakly decreases. From January to March, a strong and significant rainfall deficit is seen across the country in response to an El Niño event (Figure 1). It is important to note that these signals are the average responses to El Niño. However, as previously mentioned, actual rainfall during an El Niño year may deviate from these signals due to other factors.
These rainfall patterns have important implications for agriculture and food security across Malawi, where crop production is largely rain‑fed. Reduced rainfall during the critical January–March period can lead to moisture stress during key crop growth stages, increasing the risk of reduced yields and crop failure. In addition, delayed or erratic rainfall at the start of the season can affect planting decisions and shorten the growing season.
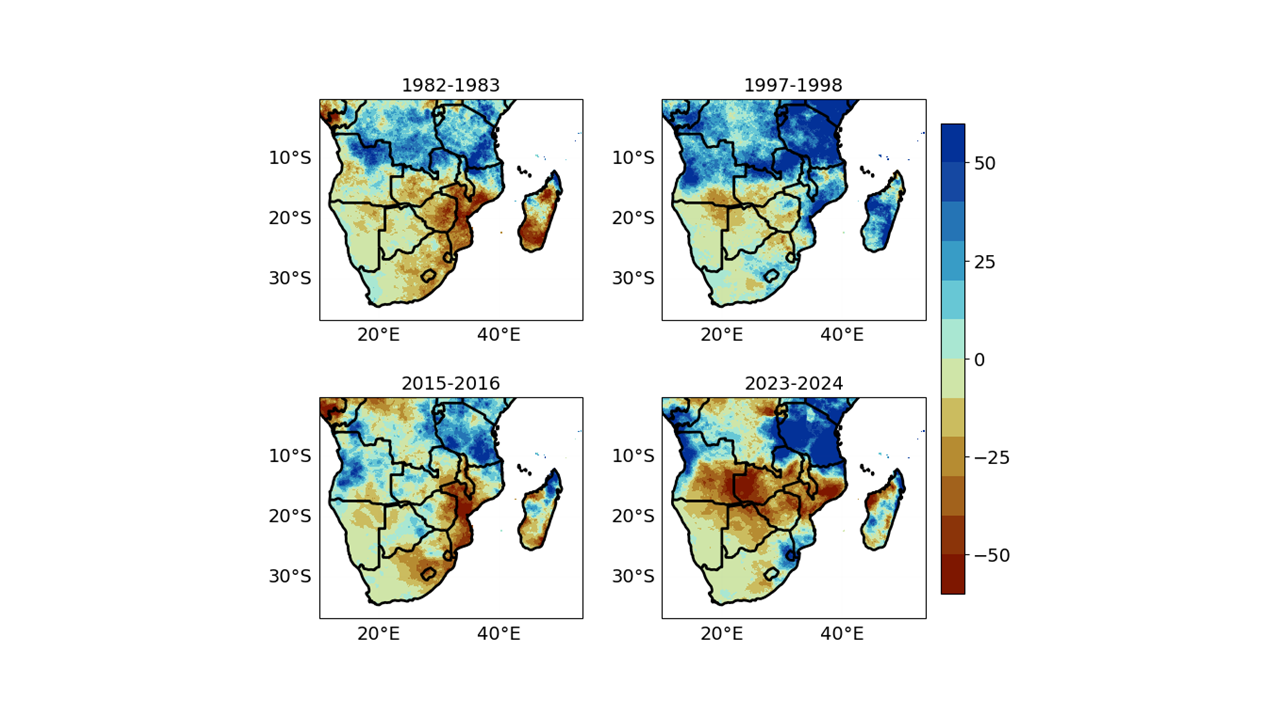
With the forecasts pointing to a strong El Niño during the second half of 2026, we revisited the rainfall responses, across Malawi, to previous strong El Niño events when the temperature of the ocean surface in the tropical East Pacific Ocean exceeds 1.5 degrees Celsius (1982–83, 1997–98, 2015–16 and 2023–24).
Overall, the rainfall responses are far from uniform (Figure 2). In 1997–98, the country experienced widespread above‑average rainfall, whereas 2015–16 and 2023–24 were marked by pronounced rainfall deficits. During 1982–83, conditions diverged even further, with the north receiving above‑normal rainfall while the south remained dry.
These contrasting outcomes highlight the influence of other weather patterns. – In particular, the temperature patterns in the Indian Ocean – can either reinforce or counteract El Niño’s effects. Yet, both in 1997–98 and in 2023–24 there was both a strong El Niño and the Indian Ocean pointed in the same direction, but Malawi’s rainfall response was almost completely opposite to what was expected. This underscores the complexity of these interactions.
A closer look at the seasonal breakdown shows that in 1982–83 and 1997–98, the October–December period was wetter than normal, followed by unusually dry conditions in January–March. In contrast, both October–December and January–March were consistently dry in 2015–16 and 2023–24.
Two key findings emerge:
There is no single “set-in-stone” El Niño rainfall response for Malawi, regardless of the strength of the El Niño event. It is therefore crucial to also monitor other weather patterns when producing the seasonal rainfall outlook.
Early‑ and late‑season impacts of El Niño can differ substantially and may vary across regions within the country.
Understanding the linkages between seasonal rainfall and other weather patterns is critical for developing seasonal rainfall forecasts. It is important to emphasize, however, that these seasonal outlooks do not provide information on how the rainfall is distributed within the season, including the potential occurrence of extremely dry or wet periods. In other words, we might predict how the season overall will look like, but not how every single month will turn out: overall wet conditions across the whole season might hide that it might be dry for a couple of months, before becoming extremely wet later.
To complement the seasonal outlook, and as we move towards a strong El Niño period, it is highly advisable to monitor regularly updated forecasts to support more informed decision‑making, particularly for the agricultural sector. One example of such complementary products, developed within ARCS, is a dry‑spell forecast. This product estimates the probability of dry spells both around the first rains and later in the season. These forecasts can guide decisions on optimal planting dates, fertilizer application timing, and the need for irrigation interventions. These are particularly important for the agricultural sector, where timely information can help farmers adjust planting dates, manage inputs, and reduce the risks of crop failure and food insecurity.
Authors: Rondrotiana Barimalala, Erik Kolstad, Sinclair Chinyoka, Helene Henriksen
We would like to acknowledge Jesse Schrage for proofreading the text.
Figure 1 - Average rainfall responses to an El Niño event across southern Africa during October-December (left) and January-March (right). Blue (brown) shading indicates more (less) rain than the usual months. Hatching are areas where the signals are unlikely to be random.
Figure 2: Deviation from the normal amount of seasonal rainfall (October-April) during strong El Niño years. Blue (brown) shading indicates more (less) rain than the usual months. Units are in mm.